Clinton, KY (Kentucky) Houses and Residents
| Clinton: | $53,638 |
| Kentucky: | $211,800 |
Mean price in 2023:
Detached houses: $447,546
Here: $447,546 State: $274,467 Mobile homes: $36,984
Here: $36,984 State: $88,004
Total population: 1,348 (Urban population: 0, Rural population: 1,422 (22 farm, 1,400 nonfarm))
Houses: 617 (487 occupied: 293 owner occupied, 203 renter occupied)
| % of renters here: | 41% |
| State: | 31% |
Housing density: 374 houses/condos per square mile
Median price asked for vacant for-sale houses and condos in 2023: $318,546.
Median contract rent in 2023: $427 (lower quartile is $246, upper quartile is $546)
Median rent asked for vacant for-rent units in 2023: $567
Median gross rent in Clinton, KY in 2023: $653
Housing units in Clinton with a mortgage: 89 (9 second mortgage, 0 home equity loan, 9 both second mortgage and home equity loan)
Houses without a mortgage: 0
Median household income for houses/condos with a mortgage: $36,351
Median household income for apartments without a mortgage: $34,372
Median monthly housing costs: $425
Compare current foreclosures near Clinton, KY:
| Photo | Address | Area | Beds / Baths | Price | Details |
|---|---|---|---|---|---|

|
#1
Richmond Dr
Clinton, KY 42031
|
1,148 sq. feet
|
1 baths 3 beds |
show details | |

|
#2
E Clay St
Clinton, KY 42031
|
912 sq. feet
|
1 baths 3 beds |
show details | |

|
#3
Elm St
Clinton, KY 42031
|
1,596 sq. feet
|
1 baths 3 beds |
show details | |

|
#4
State Route 123 E
Clinton, KY 42031
|
1,495 sq. feet
|
2 baths 2 beds |
show details | |

|
#5
Samuels St
Clinton, KY 42031
|
- sq. feet
|
- baths - beds |
show details | |

|
#6
Kentucky 307
Clinton, KY 42031
|
- sq. feet
|
- baths - beds |
show details | |

|
#7
Crestview Dr
Clinton, KY 42031
|
- sq. feet
|
- baths - beds |
show details | |

|
#8
Water St
Clinton, KY 42031
|
- sq. feet
|
- baths - beds |
show details | |

|
#9
N 2nd St
Union City, TN 38261
|
- sq. feet
|
- baths - beds |
$39,900
|
show details |

|
#10
Us Highway 45 S
Water Valley, KY 42085
|
1,350 sq. feet
|
1 baths 3 beds |
show details |
| Photo | Address | Area | Beds / Baths | Price | Details |
|---|---|---|---|---|---|

|
#11
Honey Locust Dr
South Fulton, TN 38257
|
1,708 sq. feet
|
3 baths 3 beds |
show details | |

|
#12
Wheeler Rd
Wingo, KY 42088
|
1,462 sq. feet
|
2 baths 2 beds |
show details | |

|
#13
Grissom Rd
Wingo, KY 42088
|
1,550 sq. feet
|
2 baths 4 beds |
show details | |

|
#14
Gum St
Union City, TN 38261
|
1,432 sq. feet
|
1 baths - beds |
show details | |

|
#15
Court Dr
Fulton, KY 42041
|
2,636 sq. feet
|
2 baths 3 beds |
show details | |

|
#16
State Route 339 W
Wingo, KY 42088
|
2,030 sq. feet
|
1 baths 3 beds |
show details | |

|
#17
E State Line St
Fulton, KY 42041
|
1,320 sq. feet
|
1 baths 2 beds |
show details | |

|
#18
State Route 45 S
Mayfield, KY 42066
|
1,328 sq. feet
|
1 baths 3 beds |
show details | |

|
#19
Monroe St
Fancy Farm, KY 42039
|
1,450 sq. feet
|
2 baths 3 beds |
show details | |

|
#20
State Route 45 S
Mayfield, KY 42066
|
845 sq. feet
|
1 baths 2 beds |
show details |
| Photo | Address | Area | Beds / Baths | Price | Details |
|---|---|---|---|---|---|

|
#21
Us Highway 45 E
South Fulton, TN 38257
|
2,972 sq. feet
|
3 baths - beds |
show details | |

|
#22
S Thompson St
Union City, TN 38261
|
1,403 sq. feet
|
1 baths - beds |
show details | |

|
#23
Grymes St
South Fulton, TN 38257
|
1,168 sq. feet
|
1 baths - beds |
show details | |

|
#24
Covington Ave
South Fulton, TN 38257
|
1,272 sq. feet
|
1 baths - beds |
show details | |

|
#25
Mccall St
South Fulton, TN 38257
|
2,910 sq. feet
|
1 baths - beds |
show details | |

|
#26
E Cheatham St
Union City, TN 38261
|
2,464 sq. feet
|
2 baths - beds |
show details | |

|
#27
W Paducah St
South Fulton, TN 38257
|
925 sq. feet
|
1 baths - beds |
show details | |

|
#28
E Mercer St
Union City, TN 38261
|
864 sq. feet
|
1 baths - beds |
show details | |

|
#29
Forestdale Ave
South Fulton, TN 38257
|
848 sq. feet
|
1 baths - beds |
show details | |

|
#30
Upper Catlett St
Hickman, KY 42050
|
- sq. feet
|
1 baths 3 beds |
show details |
| Photo | Address | Area | Beds / Baths | Price | Details |
|---|---|---|---|---|---|

|
#31
Greenwood St
Union City, TN 38261
|
992 sq. feet
|
1 baths - beds |
show details | |

|
#32
N 5th St
Union City, TN 38261
|
1,299 sq. feet
|
2 baths - beds |
show details | |

|
#33
Fry Ln
Fulton, KY 42041
|
- sq. feet
|
2 baths 3 beds |
show details | |

|
#34
2nd St
South Fulton, TN 38257
|
1,538 sq. feet
|
1 baths - beds |
show details | |

|
#35
N 2nd St
Union City, TN 38261
|
980 sq. feet
|
1 baths - beds |
show details | |

|
#36
Dogwood Ln
Fulton, KY 42041
|
- sq. feet
|
2 baths 4 beds |
show details | |

|
#37
Ken Tenn Hwy
Union City, TN 38261
|
1,946 sq. feet
|
2 baths - beds |
show details | |

|
#38
Bradford Pear Ln
Union City, TN 38261
|
1,488 sq. feet
|
2 baths - beds |
show details | |

|
#39
Lookout Dr
Union City, TN 38261
|
1,140 sq. feet
|
2 baths - beds |
show details | |

|
#40
County Road 1235
Arlington, KY 42021
|
1,534 sq. feet
|
1 baths - beds |
show details |
| Photo | Address | Area | Beds / Baths | Price | Details |
|---|---|---|---|---|---|

|
#41
Brundige Rd
South Fulton, TN 38257
|
1,737 sq. feet
|
2 baths - beds |
show details | |

|
#42
N Clover St
Union City, TN 38261
|
2,444 sq. feet
|
2 baths - beds |
show details | |

|
#43
E Cheatham St
Union City, TN 38261
|
- sq. feet
|
- baths - beds |
show details | |

|
#44
North Dr
Union City, TN 38261
|
- sq. feet
|
- baths - beds |
show details | |

|
#45
N Division St
Union City, TN 38261
|
- sq. feet
|
- baths - beds |
show details | |

|
#46
Thomas Russell Rd
South Fulton, TN 38257
|
1,216 sq. feet
|
- baths - beds |
show details | |

|
#47
E Cheatham St
Union City, TN 38261
|
- sq. feet
|
- baths - beds |
show details | |

|
#48
E Gibbs St
Union City, TN 38261
|
- sq. feet
|
- baths - beds |
show details | |

|
#49
N 5th St
Union City, TN 38261
|
- sq. feet
|
- baths - beds |
show details | |

|
Check over 1 million property listings on Foreclosure.com!
|
browse all offers | |||

Latest news about housing in Clinton, KY collected exclusively by city-data.com from local newspapers, TV, and radio stations

 | "Uncle Andy" (30 replies) |
| coal power plants being eliminated in Kentucky? (9 replies) |
| Is Kentucky the south or the midwest? (921 replies) |
| Is Lexington, KY a good place for a conservative, traditional family? (35 replies) |
| Worst Winter Storm in decades about to hit (68 replies) |
| Union Station and L&N Building (10 replies) |

Median year apartment built: 1968
Household type by relationship:
Households: 1,250- Male householders: 205 (73 living alone), Female householders: 276 (129 living alone)
187 spouses (187 opposite-sex spouses), 34 unmarried partners, (32 opposite-sex unmarried partners), 312 children (264 natural, 11 adopted, 36 stepchildren), 18 grandchildren, 20 brothers or sisters, 0 parents, 0 foster children, 7 other relatives, 56 non-relatives
- In group quarters: 132
Size of family households: 123 2-persons, 78 3-persons, 2 4-persons, 22 5-persons, 13 6-persons, 8 7-or-more-persons.
Size of nonfamily households: 209 1-person, 35 2-persons, 5 3-persons.
50 married couples with children.
134 single-parent households (15 men, 119 women).
98.0% of residents of Clinton speak English at home.
1.8% of residents speak Spanish at home (95% speak English very well, 5% speak English well).
0.5% of residents speak other Indo-European language at home (67% speak English very well, 33% speak English well).
Foreign born population: 3 (0.2%)
(66.7% of them are naturalized citizens)
| Here: | 6.1 |
| State: | 6.4 |
| Here: | 4.2 |
| State: | 4.4 |

- Bedrooms in owner-occupied houses and condos in Clinton, Kentucky
- 5no bedroom
- 21 bedroom
- 1012 bedrooms
- 1283 bedrooms
- 514 bedrooms
- 65+ bedrooms

- Bedrooms in renter-occupied apartments in Clinton, Kentucky
- 1no bedroom
- 331 bedroom
- 1012 bedrooms
- 613 bedrooms
- 74 bedrooms
- 05+ bedrooms

- Cars and other vehicles available in Clinton in owner-occupied houses/condos
- 5no vehicle
- 1291 vehicle
- 1032 vehicles
- 513 vehicles
- 54 vehicles
- 05+ vehicles

- Cars and other vehicles available in Clinton in renter-occupied apartments
- 44no vehicle
- 701 vehicle
- 622 vehicles
- 273 vehicles
- 04 vehicles
- 05+ vehicles

- Rooms in owner-occupied houses in Clinton, Kentucky
- 51 room
- 02 rooms
- 113 rooms
- 434 rooms
- 405 rooms
- 846 rooms
- 687 rooms
- 88 rooms
- 339+ rooms

- Rooms in renter-occupied apartments in Clinton, Kentucky
- 11 room
- 162 rooms
- 623 rooms
- 324 rooms
- 145 rooms
- 416 rooms
- 227 rooms
- 168 rooms
- 09+ rooms


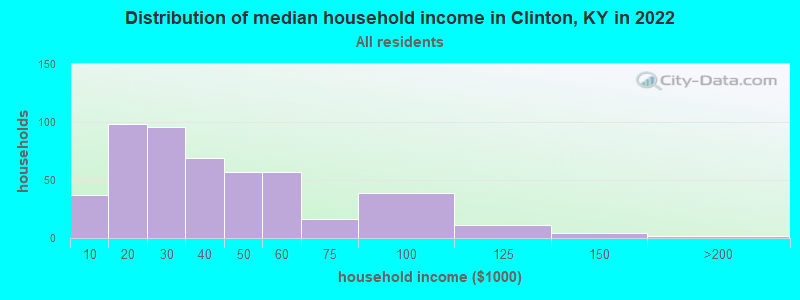
Clinton, KY household income distribution

- 48Less than $10,000
- 81$10,000 to $19,999
- 63$20,000 to $29,999
- 121$30,000 to $39,999
- 76$40,000 to $49,999
- 36$50,000 to $59,999
- 31$60,000 to $74,999
- 30$75,000 to $99,999
- 14$100,000 to $124,999
- 6$125,000 to $149,999
- 2$150,000 to $199,999
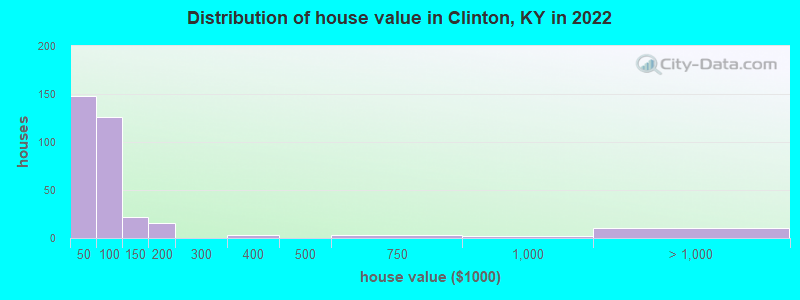
Home value of owner - occupied houses in 2023 in Clinton, KY
-
- 6Less than $10,000
- 14$10,000 to $14,999
- 15$15,000 to $19,999
- 5$20,000 to $24,999
- 15$35,000 to $39,999
- 79$40,000 to $49,999
- 30$50,000 to $59,999
- 10$60,000 to $69,999
- 9$70,000 to $79,999
- 9$80,000 to $89,999
- 9$90,000 to $99,999
- 17$100,000 to $124,999
- 3$125,000 to $149,999
- 13$150,000 to $174,999
- 2$300,000 to $399,999
- 6$500,000 to $749,999
- 2$750,000 to $999,999
- 10$2,000,000 or more
Rent paid by renters in 2023 in Clinton, KY
-
- 3Less than $100
- 3$100 to $149
- 18$150 to $199
- 19$200 to $249
- 2$250 to $299
- 8$300 to $349
- 22$350 to $399
- 22$400 to $449
- 15$450 to $499
- 41$500 to $549
- 7$550 to $599
- 6$600 to $649
- 4$800 to $899
- 29No cash rent


Percentage of workers working in this county: 46.8%
Number of people working at home: 0 (0.0% of all workers)

Travel time to work (commute)
- Less than 5 minutes: 37
- 5 to 9 minutes: 74
- 10 to 14 minutes: 28
- 15 to 19 minutes: 25
- 20 to 24 minutes: 26
- 25 to 29 minutes: 17
- 30 to 34 minutes: 68
- 35 to 39 minutes: 21
- 40 to 44 minutes: 3
- 45 to 59 minutes: 28
- 60 to 89 minutes: 17
- 90 or more minutes: 6
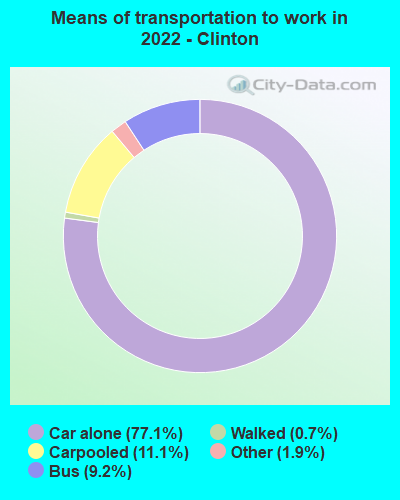
Means of transportation to work:
- Drove a car alone: 414 (70.2%)
- Carpooled: 86 (14.6%)
- Bus: 50 (8.5%)
- Taxi: 32 (5.4%)
- Walked: 5 (0.8%)

- Unemployment by race in 2023
- Unemployment rate for White non-Hispanic residents
- 18.8%Males
- 2.9%Females
- Unemployment rate for American Indian and Alaska Native residents
- 100.0%Females

- Year of entry for the foreign-born population in Clinton, Kentucky
- 02010 or later
- 32000 to 2009
- 01990 to 1999
- 01980 to 1989
- 01970 to 1979
- 0Before 1970

First ancestries reported:
- American: 224 (25.5%)
- English: 156 (17.8%)
- African: 80 (9.1%)
- Irish: 56 (6.4%)
- German: 23 (2.6%)
- Scottish: 17 (1.9%)
- European: 8 (0.9%)
- Northern European: 5 (0.6%)
- Scotch-Irish: 4 (0.5%)
- Danish: 3 (0.3%)
- Italian: 3 (0.3%)
- Dutch: 2 (0.2%)
Most common places of birth for foreign-born residents (%):
| Clinton: | 33.3% (1) |
| Kentucky: | 2.5% (4,895) |
Place of birth for U.S.-born residents:
- This state: 689
- Other state: 546
- Northeast: 9
- Midwest: 244
- South: 261
- West: 27
79.8% of Clinton residents lived in the same house 1 years ago.
Out of people who lived in different houses, 13.7% lived in this county.
Out of people who lived in different counties, 41.2% lived in Kentucky.
| Clinton: | 79.8% |
| State average: | 87.7% |
Education attainment for males 25 years and older:
- No schooling: 2
- Nursery to 4th grade: 3
- 5th and 6th grade: 2
- 7th and 8th grade: 19
- 9th grade: 22
- 10th grade: 8
- 11th grade: 6
- 12th grade, no diploma: 35
- High school graduate (or equivalency): 140
- Less than 1 year of college: 18
- Some college more than 1 year, no degree: 57
- Associate degree: 44
- Bachelor's degree: 15
- Master's degree: 4
- Professional school degree: 6
- Doctorate degree: 5

Education attainment for females 25 years and older:
- No schooling: 0
- Nursery to 4th grade: 0
- 5th and 6th grade: 0
- 7th and 8th grade: 46
- 9th grade: 5
- 10th grade: 11
- 11th grade: 7
- 12th grade, no diploma: 0
- High school graduate (or equivalency): 235
- Less than 1 year of college: 21
- Some college more than 1 year, no degree: 110
- Associate degree: 38
- Bachelor's degree: 22
- Master's degree: 16
- Professional school degree: 7
- Doctorate degree: 0


Housing units in structures:
- One, detached: 462
- Two: 25
- 3 or 4: 14
- 5 to 9: 24
- 20 to 49: 1
- 50 or more: 3
- Mobile homes: 87
Housing units lacking complete kitchen facilities in 2023: 10.0%
House/condo owner moved in on average 17 years ago
Renter moved in on average 4 years ago

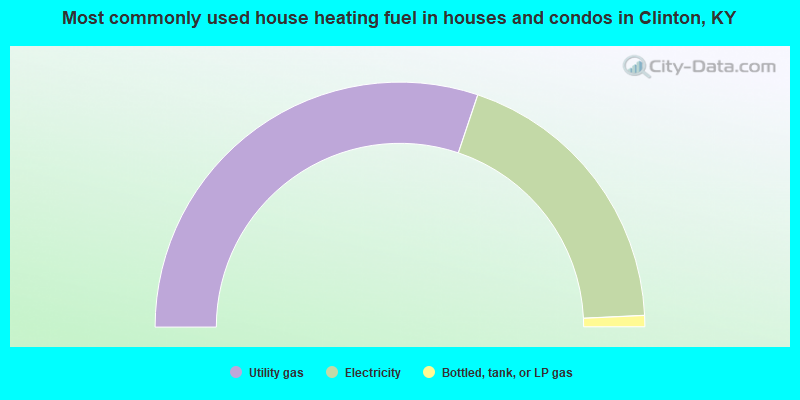
- 62.3%Utility gas
- 35.9%Electricity
- 1.8%Bottled, tank, or LP gas
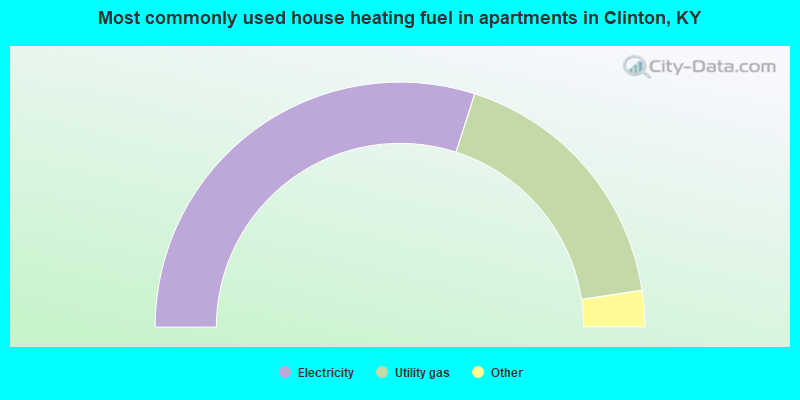
- 49.2%Electricity
- 45.2%Utility gas
- 2.5%Wood
- 2.0%Bottled, tank, or LP gas
- 1.0%No fuel used
Private vs. public school enrollment:
| Here: | 2.7% |
| Kentucky: | 16.1% |
| Here: | 11.1% |
| Kentucky: | 16.5% |
| Here: | 0.0% |
| Kentucky: | 17.5% |


