Calhoun, KY (Kentucky) Houses and Residents
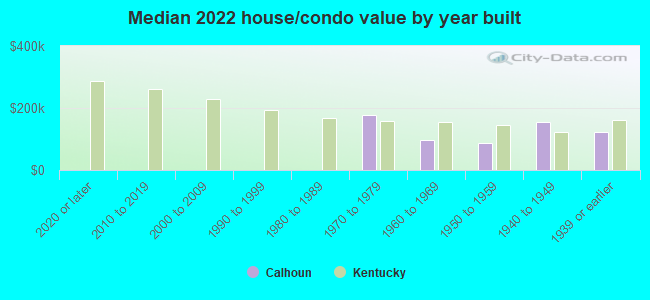
Estimated median house or condo value in 2023: $117,300 (it was $64,200 in 2000 )
Calhoun:
$117,300Kentucky:
$211,800
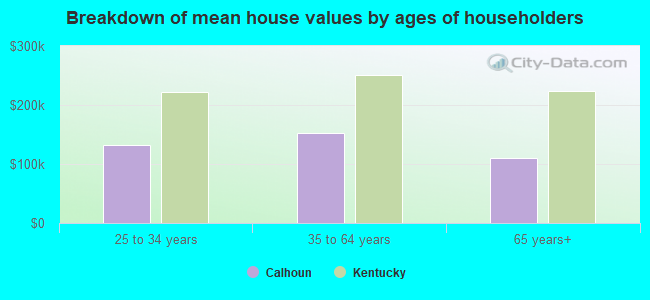
Lower value quartile - upper value quartile: $80,700 - $167,953Mean price in 2023: Detached houses: $135,093 Here:
$135,093State:
$274,467
Mobile homes: $59,433 Here:
$59,433State:
$88,004
Total population: 761 (Urban population: 0, Rural population: 829 (all nonfarm) )
Houses: 419 (350 occupied: 252 owner occupied, 105 renter occupied )
% of renters here:
29%State:
31%
Housing density: 617 houses/condos per square mile
Median price asked for vacant for-sale houses and condos in 2023: $1,194,350.
Median contract rent in 2023: $447 (lower quartile is $401, upper quartile is $637)
Median rent asked for vacant for-rent units in 2023: $1,187
Median gross rent in Calhoun, KY in 2023: $636
Housing units in Calhoun with a mortgage: 141 (20 second mortgage, 0 home equity loan, 20 both second mortgage and home equity loan )Houses without a mortgage: 3
Median household income for houses/condos with a mortgage: $92,730
Median household income for apartments without a mortgage: $49,812
Median monthly housing costs: $712
Data:
Median house or condo value ($)
Median house or condo value ($ change since 2000)
Median house or condo value ($) - White
Median house or condo value ($) - Black or African American
Median house or condo value ($) - Asian
Median house or condo value ($) - Hispanic or Latino
Median house or condo value ($) - American Indian and Alaska Native
Median house or condo value ($) - Multirace
Median house or condo value ($) - Other Race
Median price asked for mobile homes ($)
Household density (households per square mile)
Mean house or condo value by units in structure - 1, detached ($)
Mean house or condo value by units in structure - 1, attached ($)
Mean house or condo value by units in structure - 2 ($)
Mean house or condo value by units in structure by units in structure - 3 or 4 ($)
Mean house or condo value by units in structure - 5 or more ($)
Mean house or condo value by units in structure - Boat, RV, van, etc. ($)
Mean house or condo value by units in structure - Mobile home ($)
Median contract rent ($)
Median contract rent - Lower quartile ($)
Median contract rent - Upper quartile ($)
Median gross rent ($)
Urban houses (%)
Rural houses (%)
Houses occupied (%)
Houses occupied (% change since 2000)
Houses owner occupied (%)
Houses owner occupied (% change since 2000)
Houses renter occupied (%)
Houses renter occupied (% change since 2000)
Vacant housing units - For rent (%)
Vacant housing units - For rent (% change since 2000)
Vacant housing units - For sale only (%)
Vacant housing units - For sale only (% change since 2000)
Vacant housing units - Rented or sold, not occupied (%)
Vacant housing units - Rented or sold, not occupied (% change since 2000)
Vacant housing units - For seasonal, recreational, or occasional use (%)
Vacant housing units - For seasonal, recreational, or occasional use (% change since 2000)
Vacant housing units - For migrant workers (%)
Vacant housing units - For migrant workers (% change since 2000)
Vacant housing units - Other vacant (%)
Vacant housing units - Other vacant (% change since 2000)
Median monthly housing costs ($)
Median household income for houses/condos with a mortgage ($)
Median household income for houses/condos without a mortgage ($)
Median household income ($)
Median household income ($) - White
Median household income ($) - Black or African American
Median household income ($) - Asian
Median household income ($) - Hispanic or Latino
Median household income ($) - American Indian and Alaska Native
Median household income ($) - Multirace
Median household income ($) - Other Race
Mortgage status - with mortgage (%)
Mortgage status - with second mortgage (%)
Mortgage status - with home equity loan (%)
Mortgage status - with both second mortgage and home equity loan (%)
Mortgage status - without a mortgage (%)
Median year house/condo built
Median year apartment built
Household type by relationship - Male householder living alone (%)
Household type by relationship - Male householder not living alone (%)
Household type by relationship - Female householder living alone (%)
Household type by relationship - Female householder not living alone (%)
Household type by relationship - Opposite-Sex spouse (%)
Household type by relationship - Same-Sex spouse (%)
Household type by relationship - Opposite-Sex unmarried partner (%)
Household type by relationship - Same-Sex unmarried partner (%)
Household type by relationship - In group quarters (%)
Size of family households - 2-person household (%)
Size of family households - 3-person household (%)
Size of family households - 4-person household (%)
Size of family households - 5-person household (%)
Size of family households - 6-person household (%)
Size of family households - 7-or-more-person household (%)
Size of nonfamily households - 1-person household (%)
Size of nonfamily households - 2-person household (%)
Size of nonfamily households - 3-person household (%)
Size of nonfamily households - 4-person household (%)
Size of nonfamily households - 5-person household (%)
Size of nonfamily households - 6-person household (%)
Size of nonfamily households - 7-or-moreperson household (%)
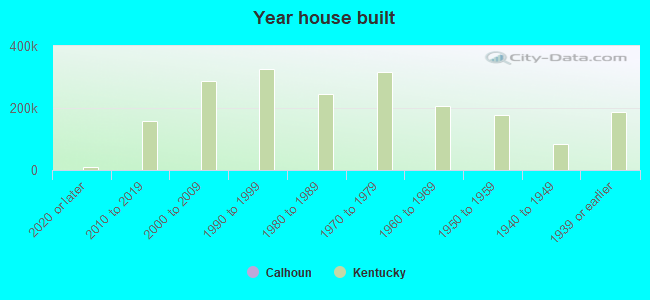
Year house built - Built 2010 or later (%)
Year house built - Built 2000 to 2009 (%)
Year house built - Built 1990 to 1999 (%)
Year house built - Built 1980 to 1989 (%)
Year house built - Built 1970 to 1979 (%)
Year house built - Built 1960 to 1969 (%)
Year house built - Built 1950 to 1959 (%)
Year house built - Built 1940 to 1949 (%)
Year house built - Built 1939 or earlier (%)
Median number of rooms in houses and condos
Median number of rooms in apartments
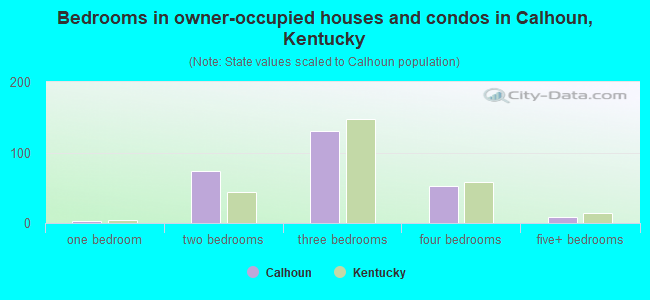
Median number of bedrooms in owner occupied houses
Mean number of bedrooms in owner occupied houses
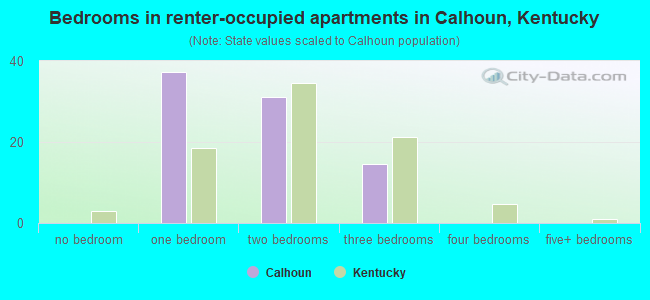
Median number of bedrooms in renter occupied houses
Mean number of bedrooms in renter occupied houses
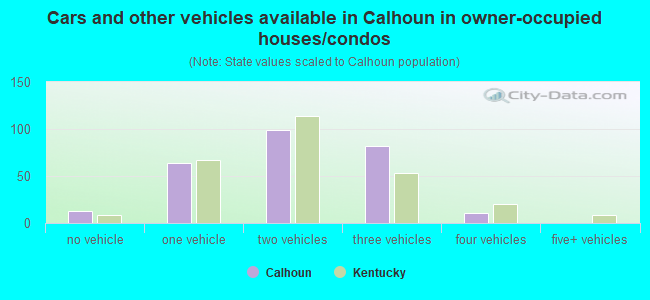
Median number of vehichles in owner occupied houses
Mean number of vehichles in owner occupied houses
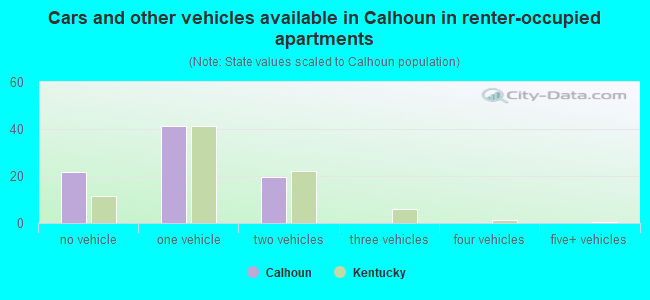
Median number of vehichles in renter occupied houses
Mean number of vehichles in renter occupied houses
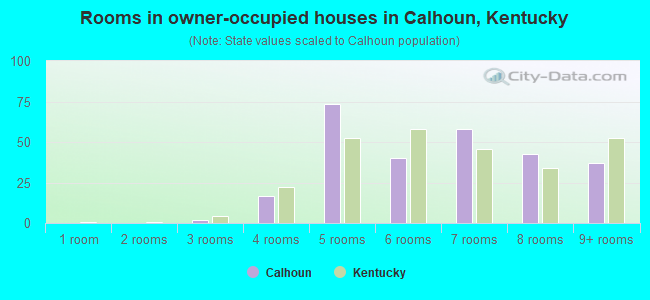
Rooms in owner-occupied houses - 1 room (%)
Rooms in owner-occupied houses - 2 rooms (%)
Rooms in owner-occupied houses - 3 rooms (%)
Rooms in owner-occupied houses - 4 rooms (%)
Rooms in owner-occupied houses - 5 rooms (%)
Rooms in owner-occupied houses - 6 rooms (%)
Rooms in owner-occupied houses - 7 rooms (%)
Rooms in owner-occupied houses - 8 rooms (%)
Rooms in owner-occupied houses - 9+ rooms (%)
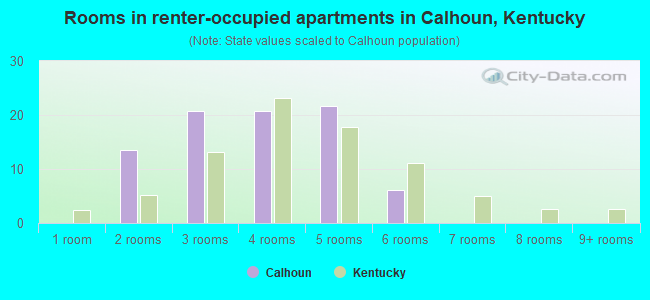
Rooms in renter-occupied houses - 1 room (%)
Rooms in renter-occupied houses - 2 rooms (%)
Rooms in renter-occupied houses - 3 rooms (%)
Rooms in renter-occupied houses - 4 rooms (%)
Rooms in renter-occupied houses - 5 rooms (%)
Rooms in renter-occupied houses - 6 rooms (%)
Rooms in renter-occupied houses - 7 rooms (%)
Rooms in renter-occupied houses - 8 rooms (%)
Rooms in renter-occupied houses - 9+ rooms (%)
Bedrooms in owner-occupied houses - no bedrooms (%)
Bedrooms in owner-occupied houses - 1 bedroom (%)
Bedrooms in owner-occupied houses - 2 bedrooms (%)
Bedrooms in owner-occupied houses - 3 bedrooms (%)
Bedrooms in owner-occupied houses - 4 bedrooms (%)
Bedrooms in owner-occupied houses - 5+ bedrooms (%)
Bedrooms in renter-occupied houses - no bedrooms (%)
Bedrooms in renter-occupied houses - 1 bedroom (%)
Bedrooms in renter-occupied houses - 2 bedrooms (%)
Bedrooms in renter-occupied houses - 3 bedrooms (%)
Bedrooms in renter-occupied houses - 4 bedrooms (%)
Bedrooms in renter-occupied houses - 5+ bedrooms (%)
Vehicles available in owner-occupied houses - no vehicle available (%)
Vehicles available in owner-occupied houses - 1 vehicle available(%)
Vehicles available in owner-occupied houses - 2 Vehicles available (%)
Vehicles available in owner-occupied houses - 3 Vehicles available (%)
Vehicles available in owner-occupied houses - 4 Vehicles available (%)
Vehicles available in owner-occupied houses - 5+ Vehicles available (%)
Vehicles available in renter-occupied houses - no vehicle available (%)
Vehicles available in renter-occupied houses - 1 vehicle available (%)
Vehicles available in renter-occupied houses - 2 Vehicles available (%)
Vehicles available in renter-occupied houses - 3 Vehicles available (%)
Vehicles available in renter-occupied houses - 4 Vehicles available (%)
Vehicles available in renter-occupied houses - 5+ Vehicles available (%)
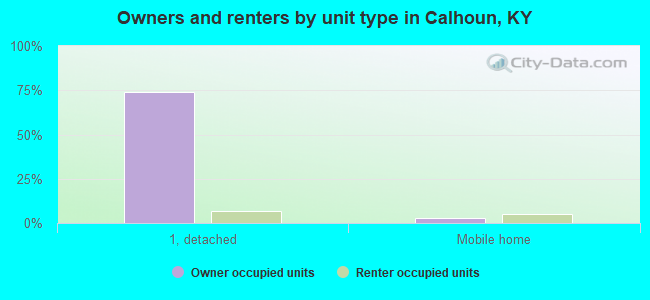
Housing units in structures - 1, detached (%)
Housing units in structures - 1, attached (%)
Housing units in structures - 2 (%)
Housing units in structures - 3 or 4 (%)
Housing units in structures - 5 to 9 (%)
Housing units in structures - 10 to 19 (%)
Housing units in structures - 20 to 49 (%)
Housing units in structures - 50 or more (%)
Housing units in structures - Mobile home (%)
Housing units in structures - Boat, RV, van, etc. (%)
Housing units in structures - Owners - 1, detached (%)
Housing units in structures - Owners - 1, attached (%)
Housing units in structures - Owners - 2 (%)
Housing units in structures - Owners - 3 or 4 (%)
Housing units in structures - Owners - 5 to 9 (%)
Housing units in structures - Owners - 10 to 19 (%)
Housing units in structures - Owners - 20 to 49 (%)
Housing units in structures - Owners - 50 or more (%)
Housing units in structures - Owners - Mobile home (%)
Housing units in structures - Owners - Boat, RV, van, etc. (%)
Housing units in structures - Renters - 1, detached (%)
Housing units in structures - Renters - 1, attached (%)
Housing units in structures - Renters - 2 (%)
Housing units in structures - Renters - 3 or 4 (%)
Housing units in structures - Renters - 5 to 9 (%)
Housing units in structures - Renters - 10 to 19 (%)
Housing units in structures - Renters - 20 to 49 (%)
Housing units in structures - Renters - 50 or more (%)
Housing units in structures - Renters - Mobile home (%)
Housing units in structures - Renters - Boat, RV, van, etc. (%)
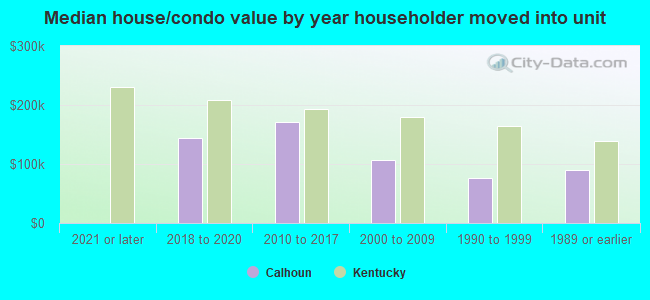
House/condo owner moved in on average (years ago)
Renter moved in on average (years ago)
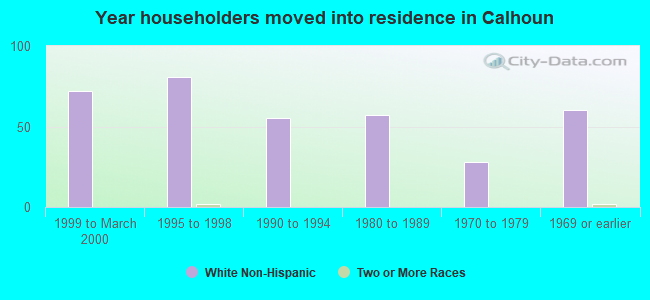
Year householder moved into unit - Moved in 1999 to March 2000 (%)
Year householder moved into unit - Moved in 1999 to March 2000 (%) - White
Year householder moved into unit - Moved in 1999 to March 2000 (%) - Black or African American
Year householder moved into unit - Moved in 1999 to March 2000 (%) - Asian
Year householder moved into unit - Moved in 1999 to March 2000 (%) - Hispanic or Latino
Year householder moved into unit - Moved in 1999 to March 2000 (%) - American Indian and Alaska Native
Year householder moved into unit - Moved in 1999 to March 2000 (%) - Multirace
Year householder moved into unit - Moved in 1999 to March 2000 (%) - Other Race
Year householder moved into unit - Moved in 1995 to 1998 (%)
Year householder moved into unit - Moved in 1995 to 1998 (%) - White
Year householder moved into unit - Moved in 1995 to 1998 (%) - Black or African American
Year householder moved into unit - Moved in 1995 to 1998 (%) - Asian
Year householder moved into unit - Moved in 1995 to 1998 (%) - Hispanic or Latino
Year householder moved into unit - Moved in 1995 to 1998 (%) - American Indian and Alaska Native
Year householder moved into unit - Moved in 1995 to 1998 (%) - Multirace
Year householder moved into unit - Moved in 1995 to 1998 (%) - Other Race
Year householder moved into unit - Moved in 1990 to 1994 (%)
Year householder moved into unit - Moved in 1990 to 1994 (%) - White
Year householder moved into unit - Moved in 1990 to 1994 (%) - Black or African American
Year householder moved into unit - Moved in 1990 to 1994 (%) - Asian
Year householder moved into unit - Moved in 1990 to 1994 (%) - Hispanic or Latino
Year householder moved into unit - Moved in 1990 to 1994 (%) - American Indian and Alaska Native
Year householder moved into unit - Moved in 1990 to 1994 (%) - Multirace
Year householder moved into unit - Moved in 1990 to 1994 (%) - Other Race
Year householder moved into unit - Moved in 1980 to 1989 (%)
Year householder moved into unit - Moved in 1980 to 1989 (%) - White
Year householder moved into unit - Moved in 1980 to 1989 (%) - Black or African American
Year householder moved into unit - Moved in 1980 to 1989 (%) - Asian
Year householder moved into unit - Moved in 1980 to 1989 (%) - Hispanic or Latino
Year householder moved into unit - Moved in 1980 to 1989 (%) - American Indian and Alaska Native
Year householder moved into unit - Moved in 1980 to 1989 (%) - Multirace
Year householder moved into unit - Moved in 1980 to 1989 (%) - Other Race
Year householder moved into unit - Moved in 1970 to 1979 (%)
Year householder moved into unit - Moved in 1970 to 1979 (%) - White
Year householder moved into unit - Moved in 1970 to 1979 (%) - Black or African American
Year householder moved into unit - Moved in 1970 to 1979 (%) - Asian
Year householder moved into unit - Moved in 1970 to 1979 (%) - Hispanic or Latino
Year householder moved into unit - Moved in 1970 to 1979 (%) - American Indian and Alaska Native
Year householder moved into unit - Moved in 1970 to 1979 (%) - Multirace
Year householder moved into unit - Moved in 1970 to 1979 (%) - Other Race
Year householder moved into unit - Moved in 1969 or earlier (%)
Year householder moved into unit - Moved in 1969 or earlier (%) - White
Year householder moved into unit - Moved in 1969 or earlier (%) - Black or African American
Year householder moved into unit - Moved in 1969 or earlier (%) - Asian
Year householder moved into unit - Moved in 1969 or earlier (%) - Hispanic or Latino
Year householder moved into unit - Moved in 1969 or earlier (%) - American Indian and Alaska Native
Year householder moved into unit - Moved in 1969 or earlier (%) - Multirace
Year householder moved into unit - Moved in 1969 or earlier (%) - Other Race
Housing units lacking complete plumbing facilities (%)
Housing units lacking complete kitchen facilities (%)
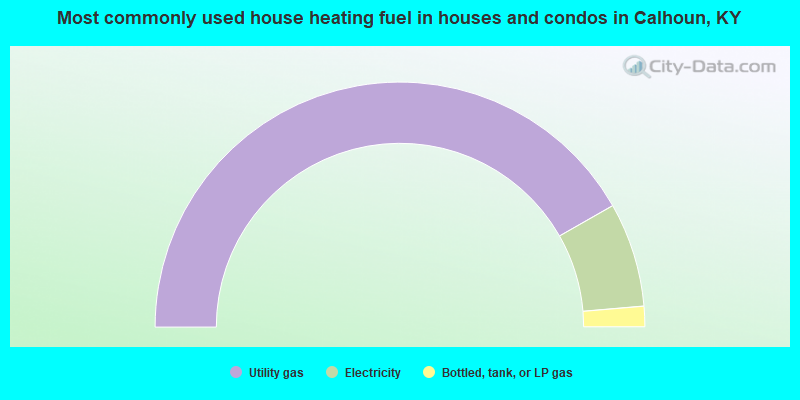
House heating fuel used in houses and condos - Utility gas (%)
House heating fuel used in houses and condos - Bottled, tank, or LP gas (%)
House heating fuel used in houses and condos - Electricity (%)
House heating fuel used in houses and condos - Fuel oil, kerosene, etc. (%)
House heating fuel used in houses and condos - Coal or coke (%)
House heating fuel used in houses and condos - Wood (%)
House heating fuel used in houses and condos - Solar energy (%)
House heating fuel used in houses and condos - Other fuel (%)
House heating fuel used in houses and condos - No fuel used (%)
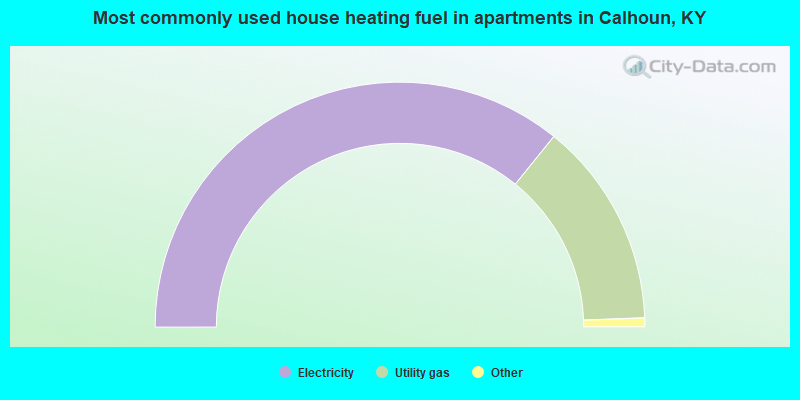
House heating fuel used in apartments - Utility gas (%)
House heating fuel used in apartments - Bottled, tank, or LP gas (%)
House heating fuel used in apartments - Electricity (%)
House heating fuel used in apartments - Fuel oil, kerosene, etc. (%)
House heating fuel used in apartments - Coal or coke (%)
House heating fuel used in apartments - Wood (%)
House heating fuel used in apartments - Solar energy (%)
House heating fuel used in apartments - Other fuel (%)
House heating fuel used in apartments - No fuel used (%)
Latest news about housing in Calhoun, KY collected exclusively by city-data.com from local newspapers, TV, and radio stations
Layla attended classes at
Calhoun Elementary, the school she should attend according to the familys home location, from kindergarten until a period in third grade and the experience, according
(timesleader.net)
new 9,600-square-foot facility on Highway 136 outside of
Calhoun next to the home of Average Joes Auto Sales, an auto sales and towing business operated by Joes son, Dylan.
(messenger-inquirer.com)
At the McLean County Courthouse in
Calhoun , Coleman presented five awards funded by the Cleaner Water Program, which included: $190,048 to the North McLean County Water District for repairing water
(messenger-inquirer.com)
Median year house/condo built: 1957Median year apartment built: 1976Household type by relationship:
Households: 785
Male householders: 178 (95 living alone ), Female householders: 168 (43 living alone )127 spouses (124 opposite-sex spouses ), 30 unmarried partners , (30 opposite-sex unmarried partners ), 153 children (142 natural , 0 adopted , 11 stepchildren ), 30 grandchildren , 3 brothers or sisters , 1 parents , 0 foster children , 0 other relatives , 20 non-relatives In group quarters: 73
Size of family households: 92 2-persons , 54 3-persons , 11 4-persons , 13 5-persons , 2 6-persons .
Size of nonfamily households: 143 1-person , 34 2-persons , 6 3-persons .
73 married couples with children. single-parent households (0 men , 31 women ).
100.1% of residents of Calhoun speak English at home.
Foreign born population: 9 (1.1%)of them are naturalized citizens )
Median number of rooms in houses and condos:
Median number of rooms in apartments
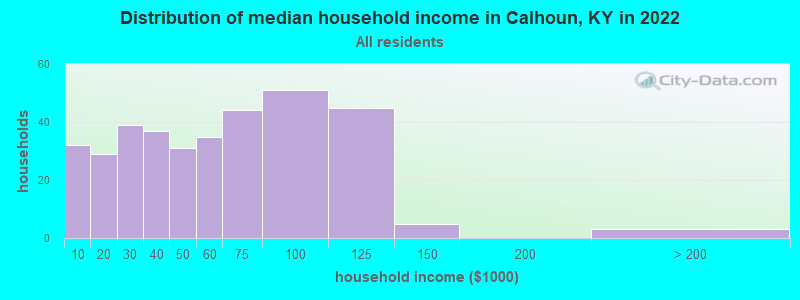
Calhoun, KY household income distribution 36 Less than $10,00030 $10,000 to $19,99965 $20,000 to $29,99925 $30,000 to $39,99922 $40,000 to $49,99920 $50,000 to $59,99934 $60,000 to $74,99934 $75,000 to $99,99971 $100,000 to $124,99913 $125,000 to $149,9996 $150,000 to $199,9993 $200,000 or more
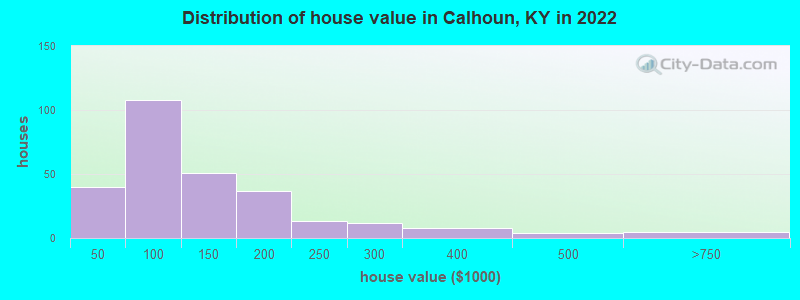
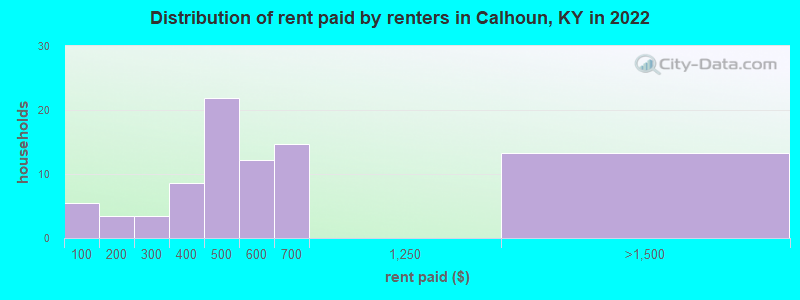
Home value of owner - occupied houses in 2023 in Calhoun, KY 2 Less than $10,0002 $15,000 to $19,9992 $20,000 to $24,99910 $30,000 to $34,9990 $35,000 to $39,99916 $40,000 to $49,99944 $70,000 to $79,99910 $80,000 to $89,99913 $90,000 to $99,99942 $100,000 to $124,99918 $125,000 to $149,99930 $150,000 to $174,9997 $175,000 to $199,99912 $200,000 to $249,9991 $250,000 to $299,9993 $300,000 to $399,9998 $400,000 to $499,9992 $500,000 to $749,999Rent paid by renters in 2023 in Calhoun, KY 9 Less than $1002 $150 to $1992 $250 to $2994 $300 to $3495 $350 to $39936 $400 to $4496 $450 to $4999 $550 to $59913 $600 to $64918 $1,250 to $1,4992 No cash rent
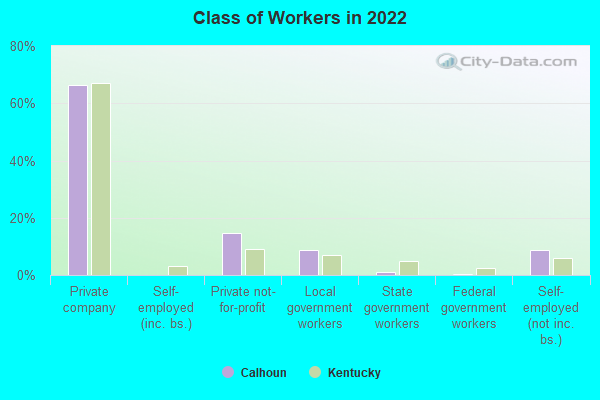
Percentage of workers working in this county: 40.5%Number of people working at home: 23 (7.5% of all workers )
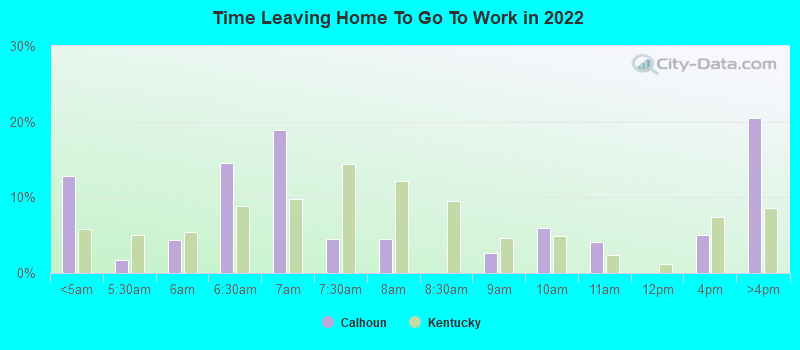
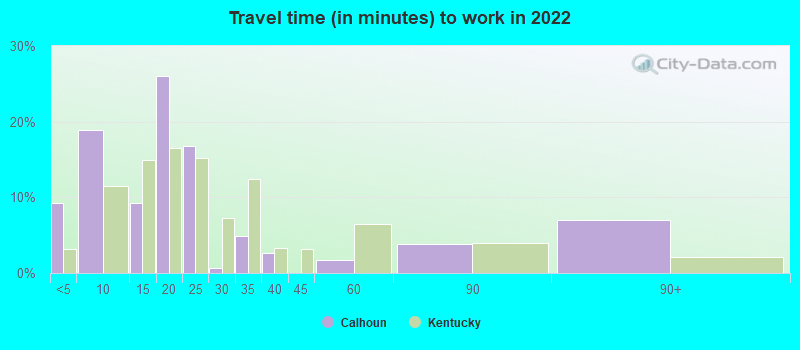
Travel time to work (commute)
Less than 5 minutes: 105 to 9 minutes: 2610 to 14 minutes: 1415 to 19 minutes: 4020 to 24 minutes: 1425 to 29 minutes: 2330 to 34 minutes: 6735 to 39 minutes: 340 to 44 minutes: 545 to 59 minutes: 2360 to 89 minutes: 4290 or more minutes: 13
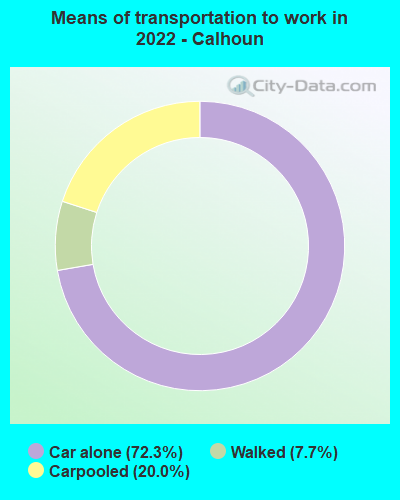
Means of transportation to work:
Drove a car alone: 291 (66.0%)Carpooled: 90 (20.4%)Walked: 31 (7.0%)Worked at home: 24 (5.4%)
Unemployment by race in 2023
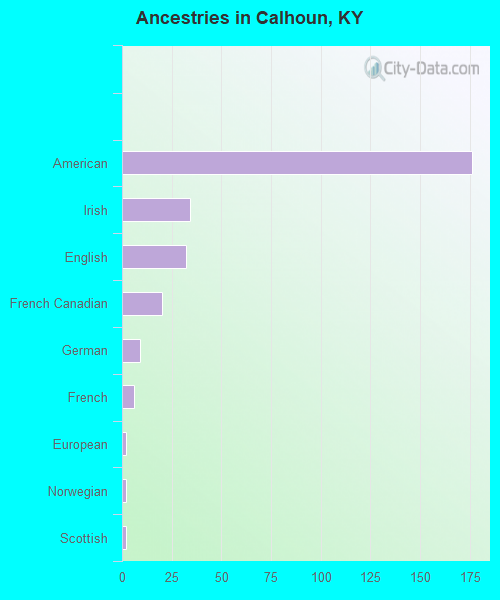
Unemployment rate for White non-Hispanic residents 6.6% Males9.4% FemalesFirst ancestries reported:
American: 155 (48.2%)
English: 45 (14.0%)
Irish: 14 (4.4%)
French Canadian: 11 (3.4%)
French: 7 (2.2%)
German: 7 (2.2%)
Dutch: 6 (1.9%)
Scottish: 6 (1.9%)
European: 4 (1.2%)
Norwegian: 2 (0.6%) Most common places of birth for foreign-born residents (%): England Calhoun:
66.7% (6)Kentucky:
0.8% (1,551)
Place of birth for U.S.-born residents:
This state: 611Other state: 165Northeast: 2Midwest: 133South: 26West: 3 86.4% of Calhoun residents lived in the same house 1 years ago.
Out of people who lived in different houses, 22.1% lived in this county.
Out of people who lived in different counties, 76.0% lived in Kentucky.
Calhoun:
86.4%State average:
87.7%
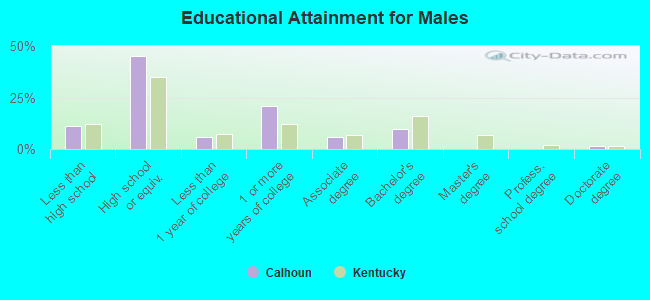
Education attainment for males 25 years and older:
No schooling: 0Nursery to 4th grade: 05th and 6th grade: 07th and 8th grade: 69th grade: 510th grade: 711th grade: 012th grade, no diploma: 2High school graduate (or equivalency): 117Less than 1 year of college: 9Some college more than 1 year, no degree: 57Associate degree: 34Bachelor's degree: 20Master's degree: 0Professional school degree: 0Doctorate degree: 3
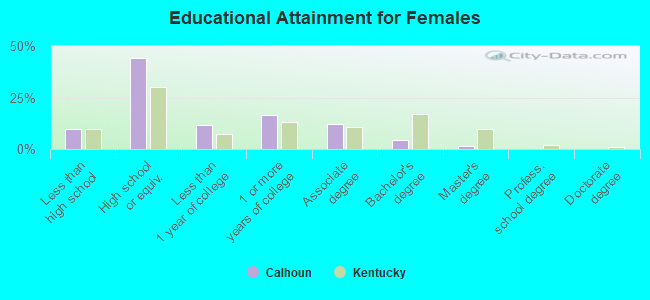
Education attainment for females 25 years and older:
No schooling: 2Nursery to 4th grade: 05th and 6th grade: 07th and 8th grade: 29th grade: 310th grade: 1511th grade: 512th grade, no diploma: 0High school graduate (or equivalency): 129Less than 1 year of college: 35Some college more than 1 year, no degree: 44Associate degree: 49Bachelor's degree: 13Master's degree: 5Professional school degree: 0Doctorate degree: 0
Housing units in structures:
One, detached: 300Two: 45 to 9: 4410 to 19: 450 or more: 14Mobile homes: 51Housing units lacking complete plumbing facilities in 2023: 4.8%Housing units lacking complete kitchen facilities in 2023: 4.3%House/condo owner moved in on average 15 years ago
Renter moved in on average 2 years ago
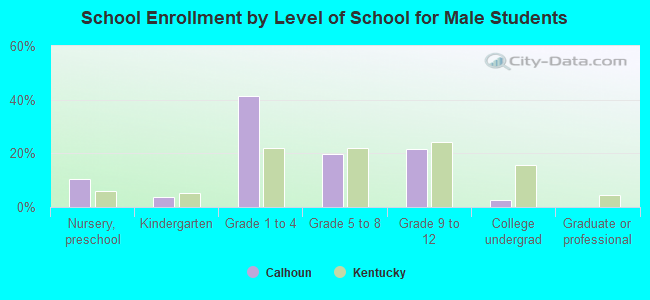
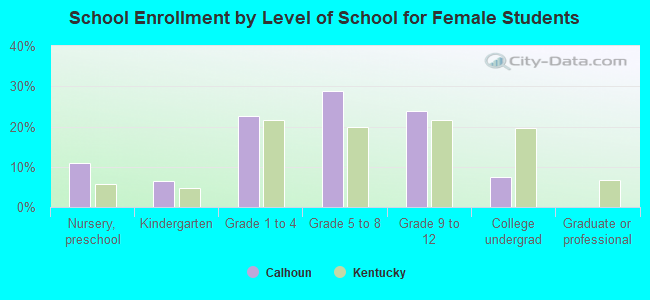
Private vs. public school enrollment:
Students in private schools in grades 1 to 8 (elementary and middle school): 5 Students in private schools in grades 9 to 12 (high school): 0 Students in private undergraduate colleges: 0