2919 seconds old.
¡Use Control+ Function key+ F5 key, or clear cache before refresh to get latest images! Listen to the NOAA:
Low Data Images:
Low data full OH Static 6-21
USA Plot w/ Radar 6-21
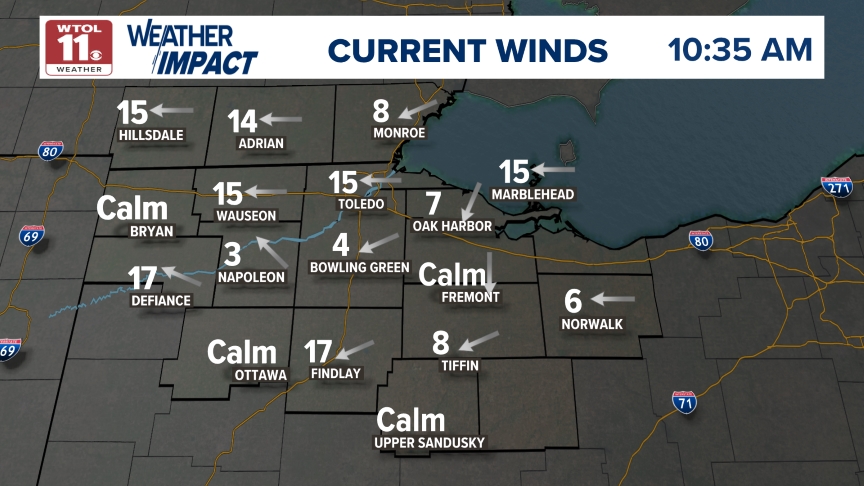
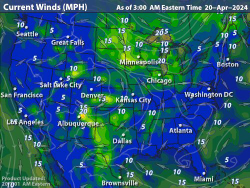
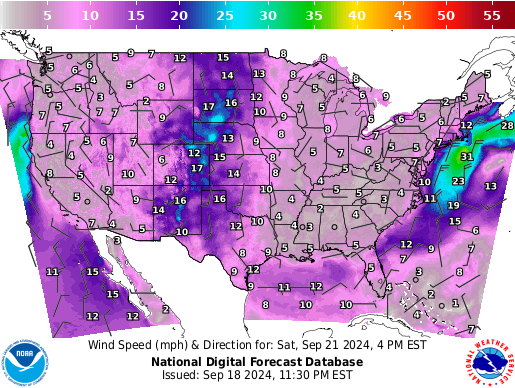
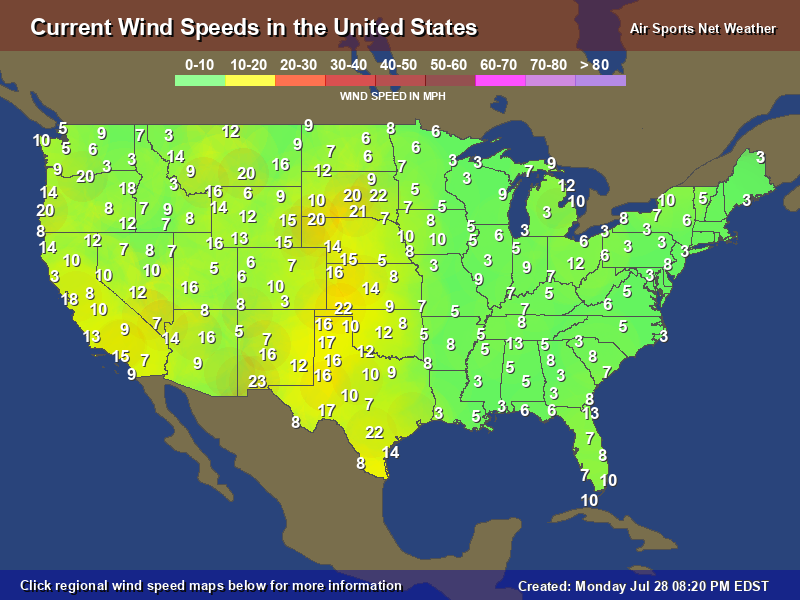
current wind give me a break!
Canada Temp 9-21">usa temp 6-21
TDWR Hi Rez Multi county 6-21 (click here:)) 30min&now: USA Humidity 6-21 Anim Ohio lo data 6-21 Winds: working
penwind
pen nepsi:
7h\3h
verify usa 12hftp.cuttingedgecoatings.org:
The idea of this webpage is borne out of necessity: 1. Radars are not animated or zoomed properly. (1 hour per 45 mile radius; higher resolution on local radar, while need lower resolution on bigger regional radar to not gag data caps and load on weak cell signal.) 2. Some radars are exaggerated, some under report. 3. All forecasts are wrong. If I get 11 forecasts each day, I get 11 different predictions which need to be compared and verified by the current maps and images. 4. A person who needs good weather is always going to be using a cellular connection. Thus the main jump page, with images, should be under one meg, yet have the 40 essential images and weather products--yet have links to large data hogging more radars, future maps, current maps, for the home use.
I achieve all of the above by: no ads; grabbing images and text on the home machine then processing for animation length, cropping, and optimal compression, then uploading; an external proxy that creates the most compressed images possible on images that I don't want to pull and process locally. (Slightly longer load time due to travel through a compressing proxy, yet far less data.) ....The result is the ugliest, yet most leanest, powerful weather webpage on the internet for Akron, Cleveland, and Northeast Ohio.
Short Work Flow Description: In short, I look at 40 ish images (starting in Ohio, then maps, then animated radars), and then 20 ish forecasts. My landing page is targeting under 1 meg for cell reasons, while there are about another 4 or 5 supplemental pages which do not care about data savings. My Detailed Work Flow: I look at Ohio; then, all the maps that determine the direction, dissipation, augmentation of the rain (the upper wind maps, pressure, cape, predicted cape, humidity, temp/wind for actual up to minute front location); I then go back to Local, State, regional, animations; I then look at the future maps; I then look at the low data iframed stuff; At home, I then look at the current maps page; At home, I then look at the more radar page; at home, I then look at the future maps; on the cell, I often looke at the home made radar page because of its low bandwidth and long range radars; The high resolution radars are curently dead since the 48 nm radars have moved to plymouth.edu and they are trying to block robots and iframe, like jerks. ; During tornados Plymouth directional radar may be the only way to see the tornados; I will eventually add the tornado radar to the more rads and either the home or high def radar page. ......Work Flow challenges: The data challenge has been bested, by the described strategies. There is the need to memorize 40 weather maps and radars into my short term memory and overlay them; so, this is partly why I interleave some redundant images into the workflow while being out of place; the other reasons for redundant images on the main landing page is because the sources play games with the image locations (A web designer needs to be paid for something, right? Shuffling deck chairs is 98 percent of the reason for upgrades and new website design.), so this gives my page a robustness (until I get the time to hunt down replacements) that it wouldn't otherwise have; also, frankly, radars are often wrong, plainly wrong, as are maps and satelite images and forecasts, so the solution is redundant side by side images and forecasts.
I really have zero interest in making money off this page. Making money means ads and destroying the core idea of the page. I believe weather should be free and open sourced to anyone who needs it--people's lives and livihood are at stake. Interestingly, this page started in 2008, yet big business (accuweather to weather channel) has paid google so much money that I don't even get a listing, no matter the search string that you use. Thus, I seldom see any human hits per year. I don't care, because I am the main person who relies on this site to determine at 7 am what the weather will do for the next 9 to 12 hours by disregarding 10 of the 11 forecasts that I look at. I also might pull the page every hour or half hour on rainy days, without eating up my data as I would using weather.gov, or worse, the commercial weather sites. I no longer need to open 60 tabs each morning to see the essential weather products that I need to make up my mind.
Quite frankly, no one should be interested (as I am) on the exact half hour of rain-with 100 percent accuracy- except for painters, hikers, boaters and cyclists. I suppose a landscaper or roofer will merely cover and quit work as needed, while a painter will loose hundreds and hundreds of dollars of paint if the rain hits early, else loose valuable days on false rain alarms. A boater who plans his day early will definitely need this page. A hiker or cyclist may have more short term plans, and accuweather might be enough for them.
June 2021 blog
This week, in 2021, all of my favorite prediction sources have been grossly wrong. So much for accuweather, dark sky weather dot gove, dupage, and psu. For example monday and friday, they all predicted rain around 2 pm. Monday it hit at 11:50, and Friday it hit at 10:40. Monday it rained for 5 minutes, when weather dot gov said 4 hour duration and the rest said 2 hours. Clearly on Monday, the weather maps showed that it would rain zero to a few minutes, while the timing also was clearly earlier than the computer models. Clearly, on Friday the rain would hit before noon. Also, on Friday, all (I mean all) forecasts had the rain returning at 7 pm and raining for the next 5 hours. Friday, the rain never returned, which was obvious if you studied the weather maps in the morning: the air just wasn't that unstable and moist in North East Ohio.
Conclusion: the OBV (humanly observable forecast) is always better than a computer model. The only caveat is that the human must be awake, have the necessary maps, and have the time and motivation to pay attention. Because this is not always possible, a computer is a pretty good stand in for when the human brain is abscent. Far better than nothing. Also, the computer is great for "proof reading" human judgement, and oftent brings to light variables that the human has overlooked. I know this from years using a computer for estimating time. The computer proofs the human, while the human proofs the computer.
OBV and computer caveats: We kind of assume that the weather service gives us all the data necessary (if we look hard enough) to make a good decision. This is far from likely. Emperically for 3 to 4 decades, I have witnessed my county store up sunlight heat in the many roads and roofs, and dry up marching, organized rain that was coming my way. I do not know if there is a heat island sat or map to see or measure this. Convergence, Lifted index, total index, cape is a separate issue. Also, Ohio gets into moods that last 30 days. For some reason, conditions in one year (say in june) will yield different result than the exact same conditions in another year. This is why you need a human to factor in the the "mood of Ohio". For example, in the summer of 2014, it misted rain every morning until noon. Not one of the hrr or other forecasts mentioned rain, yet it did. Only the hi rez tdwr picked up the rain, while nearly every weather site didn't have the rain on their radar, as well as the most of their station reporting conditions. Yet clearly, it was raining every morning in 2014, enough to wash off paint. A human can factor in the 'mood', based on recent weather, while a computer can't. Who know exactly what missing telemetry, maps, sat images, etc., that are missing which is that missing puzzle piece?
Health of the site update: I have had 80 percent of my sources dry up over the last 6 months. The weather.gov, for example, recently gutted their images quality and accessiblity, in their attempt to upgrade. Their radar.weather.gov page is not even usable, as their animation lacks sufficient length to tell what is going on, while the it crams gigs of data down your pipes with too hirez images of 5 states away, while the resolution is too low to see 100 mile local radar within a city resolution quality. ...So, I spent the last 60 hours of my time updating my sources, purging dead sources, finding new content.... I still need lots of work on the current map page to replace some of the old maps. I need to scour my scripts, looking for any dead sources that I am still pulling. I need to fix the dead tornado radars, the dead local high resolution radar page. I need to probably spend a week to simplify my scripts that still use code from my old vision and needs of 2008 and was built upon, until 2021. I also need to upgrade my main scripting computer with a new mother board...Probably, most of all, as of June 18, 2021, I am unhappy with the animation length of my homemade radars. I think that, because the old animation scripts were timed on 2008 computer, the script is running too fast on a 2012 to 2018 generation cpu. Animated radar (proper zoom, resolution, frame delay, animation length) are essential to determining rain duration and eta. A good animation will always trump the accuweather minute cast or any other hrrr. .. I currently have too many upper air maps because I am evaluating which mb applies to each season. Eventually, I will clean it up by choosing 2, if possible...In my last 50 hours of patching dead images with new ones, I managed to bloat the main page from 600 kb to 3 megs. I need to hunt down the offending large iframe and image. Note that I use php, which allows me to serve a smaller page to iphone and android devices than the desktop.
Animation philosophy; for local muticounty radar: high resolution, 60 to 80 mile radius, 10 minute frame jump, background of highways and counties, 1 hour; state wide radar: fair resololution, 20 minutes frame jumps, 240 mile radius, 6 hour animation; regional radar: great lakes 600 mile radius, 12 hour length, low resolution; half hour frame jump; half usa animation: 12 hour animation, low rez as possible, 1 hour frame jump, 24 hour length.... The ideal animation should be around 100k max size. However, a 24 hour, half usa animation is not needed on the jump page, as it is only looked at in the morning, usually on a home isp, which do not count the megs. A 24 hour radar is really excellent at seeing what it will do in the next 48 hours, based on the weather pattern that you see.
I used to have a ton of weather links. However, because the urls keep changing locations, as webmasters shuffle their cards for money, I couldn't keep up with the constant changes over the years. It is hard enough to find a free week in the winter to update dead image links.
Current ToDOS:
*Fix script for current temp and daylight hours for reliable location of line.
*More animations. update current ones
*Tornado radar
*get file size of all images and iframes on main page for audit of size.
*My mirror akronohioweather.com ftp needs to stop blocking my ip address, so that I can use its uploaded weather images.
*cleanup wx4, while adding more wind and temp maps for indiana and michigan.
*i NEED TO PHP ?DATE ALL IMAGES SINCE chrome no long has a working cache refresh.
* I need to php all sub pages to get better images.
* I need to figure out universal menu system. Probably php is the answer.
Garber Painting Akron ~ Est. 1945 The Cutting Edge of Experience ~ Cutting Edge Coatings trademarked 1995 :


 USA Plot w/ Radar 6-21


 TDWR Hi Rez Multi county 6-21 (click here:))


 working


 penwind
 pen nepsi:


 7h\3h
7h\3h


 https://www.weatherwx.com/images/hwi3_mapset/generated/cur__us_oh_wx.png

 FUTURE RADS, 4h and 7h:


